%20(1)%20(1)%20(1).png)

Getting actionable product usage data to your sales reps
Product usage data is a sales person’s best friend when it comes to closing more expansion revenue, converting trial users, or anything in between. But if you’re someone who wants their team to “live in Salesforce”, or you’re someone who’s already in Salesforce all day, wouldn’t it be handy if all the insights you needed were right there?
We hear you. So we recently released the ability to pipe data-driven, actionable insights directly into Salesforce as Salesforce Tasks. Sales reps can act on the best opportunities at the exact right time, based on the actions people took inside your product. (Read: no more digging through stale BI dashboards or reports.)
Not only do Salesforce Tasks help with managing priorities, but you can also use Salesforce Tasks to build powerful, meaningful reports that show which sales activity drives new opportunities and closed-won expansion deals. Here’s a tutorial on how to build a report that ties Salesforce Tasks to the outcomes you care about.
Report: How many Opportunities were created after a Salesforce Task was completed?
In this example, you’re building a report to see which Accounts had Opportunities created after a Salesforce Task was completed.
Note: One of the downfalls of this report is that Opportunities are counted on a per activity basis. This means that if multiple Tasks occurred before an Opportunity was created, you’ll get multiple counts. Even if this isn’t your end goal, follow the steps below, then continue down this blog to build the second report.
Step 1: Mapping Opportunity Created Date to Accounts
To start, you’ll need to create a custom field for the Opportunity Created Date.
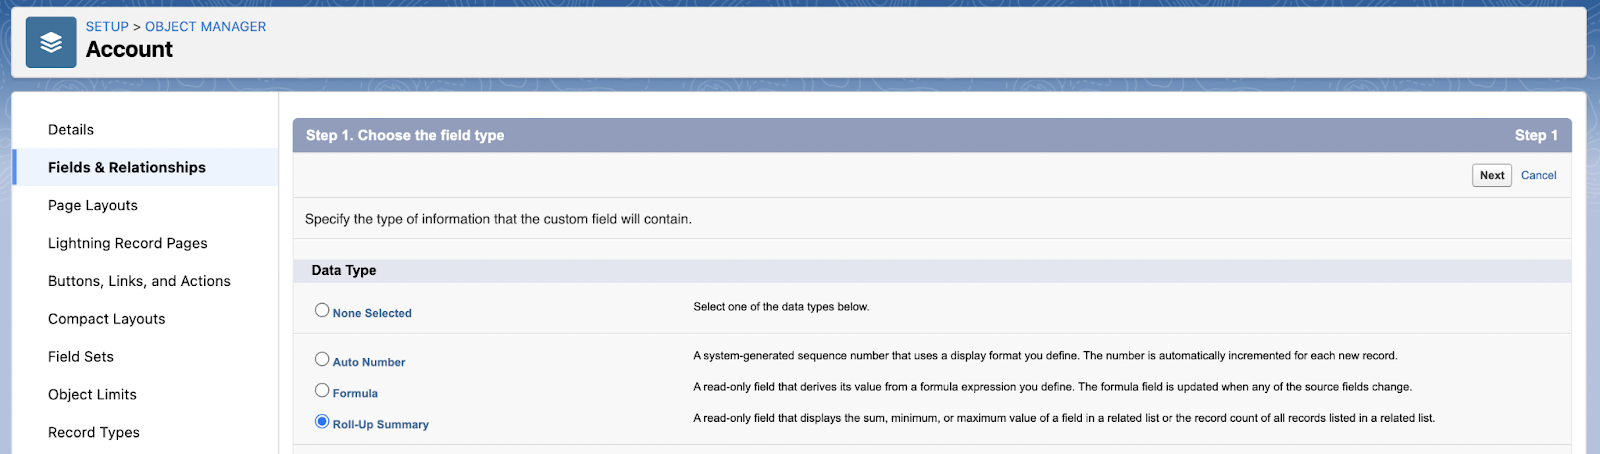
Click Setup, then navigate to your Object Manager, and create a Custom Field. Select the Roll-up Summary Type.

Next, name your Custom Field, and then select the following options. You can choose to filter the records by criteria if you would like at this stage.
Congrats, you should be able to see the most recently created Opportunity’s created date mapped to each Account!
Step 2: Building your report
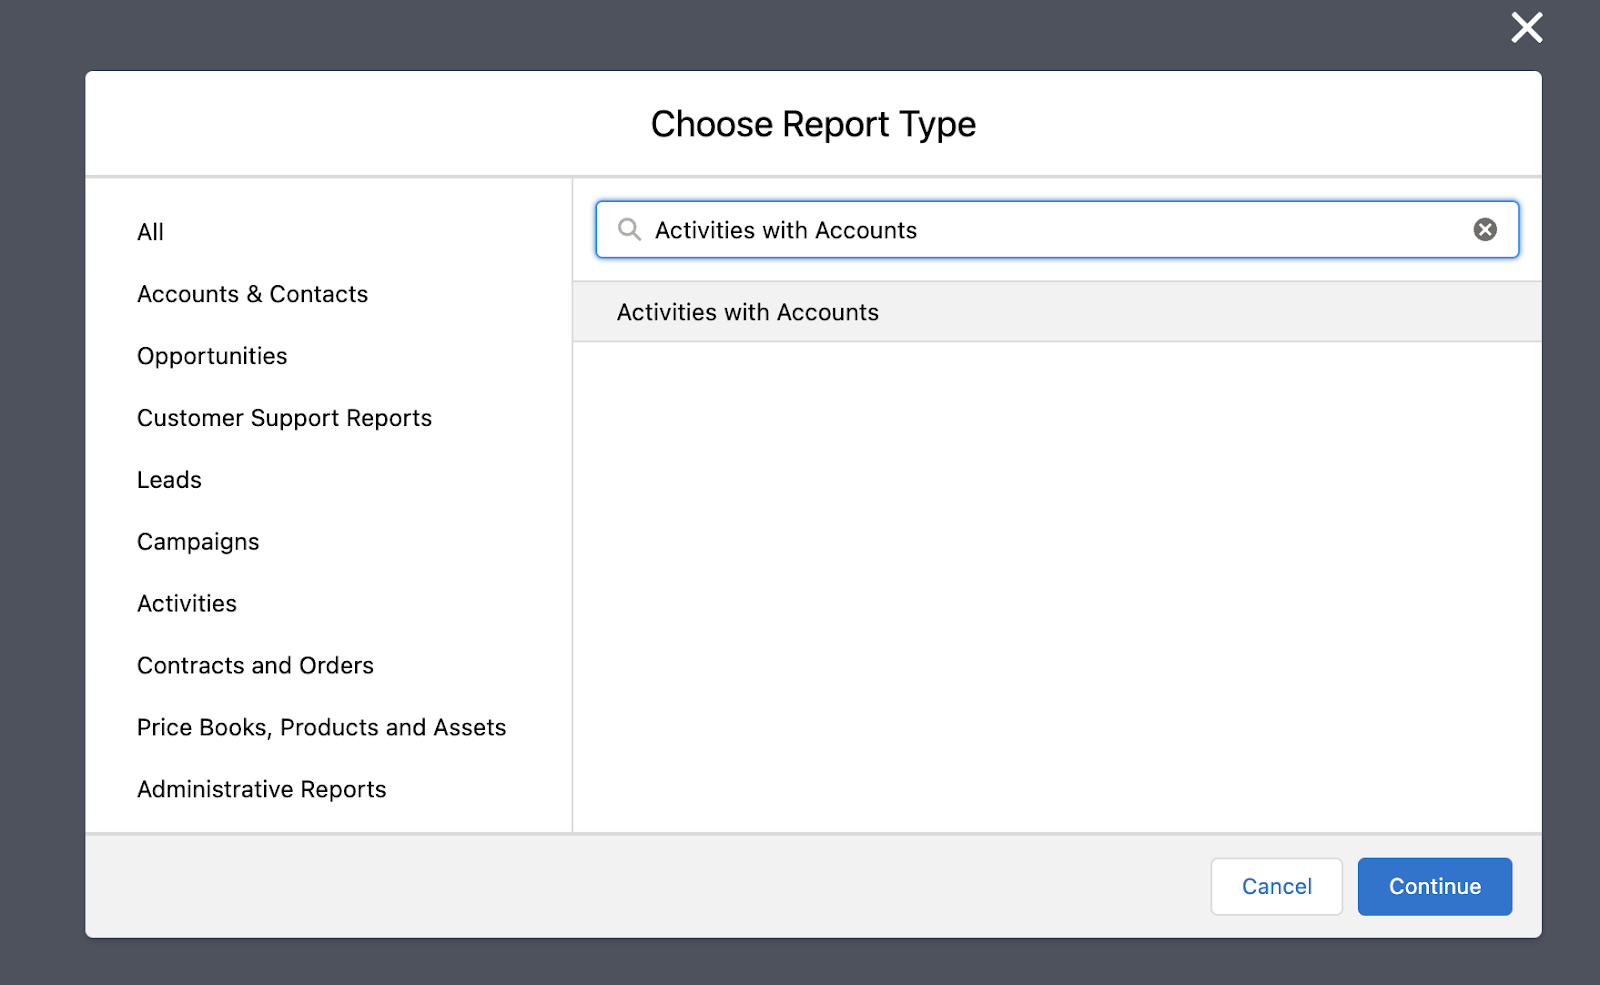
Let’s go ahead and build a report now! Navigate over to your Reports and create a new Report. Select the Activities with Accounts type.

Use the following columns in your report. Notice that “Last Opportunity” is the Custom Field we created earlier that we are using now in the report. Completed Date is the date when the Task was completed.
Now, you’ll have a view of all of your activities mapped to their accounts and the most recent Opportunity created date. You can filter for the tasks you care about by using the “Filters” option to select Tasks, Events, Task Types, or even filter by Subjects.
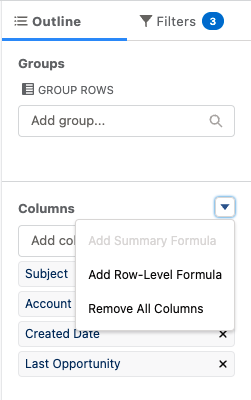
Next, you want to figure out how many Opportunities were created after the Tasks you care about were completed. You’ll need to use a row-level formula to do this. To start, add a row-level formula by clicking on the dropdown shown below.

Enter the formula shown below, and let’s walk through exactly what is going on here. The row-level formula is similar to when you write a formula in an Excel cell. It takes a row in the report and calculates a value based on the specified columns in that report. In this case, we are checking to see if the date (if you’re using Completed Date, you’ll want to use Completed Date here) is less than the Opportunity Created Date. This indicates that the Task was created (or completed) before the Opportunity was created. We mark this row value as 1 if the logical comparison is true, and 0 if it is false.
IF(COMPLETED_DATE<Account.Last_Opportunity__c,1,0)
Go ahead and hit apply. Now you can see how many activities can be linked to a newly created Opportunity.
As we mentioned above, one of the downfalls of this report is that Opportunities are counted on a per activity basis. This means that if multiple Tasks occurred before an Opportunity was created, you’ll get multiple counts. So, let’s build the follow report as well:
Report: How many Accounts had new Opportunities where a Task was completed before the Opportunity was created?
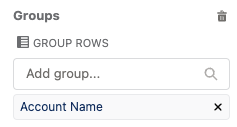
Take the report you’ve already created, and simply group the columns by Account, as shown below:
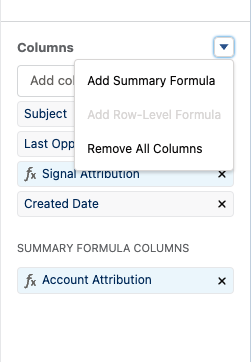
Next, you’ll need to create a summary formula that basically looks across all the activities that resulted in an opportunity being created and “summarizes” that count at the Account level. Similarly to the row-level formula, go ahead and create a summary-level formula.
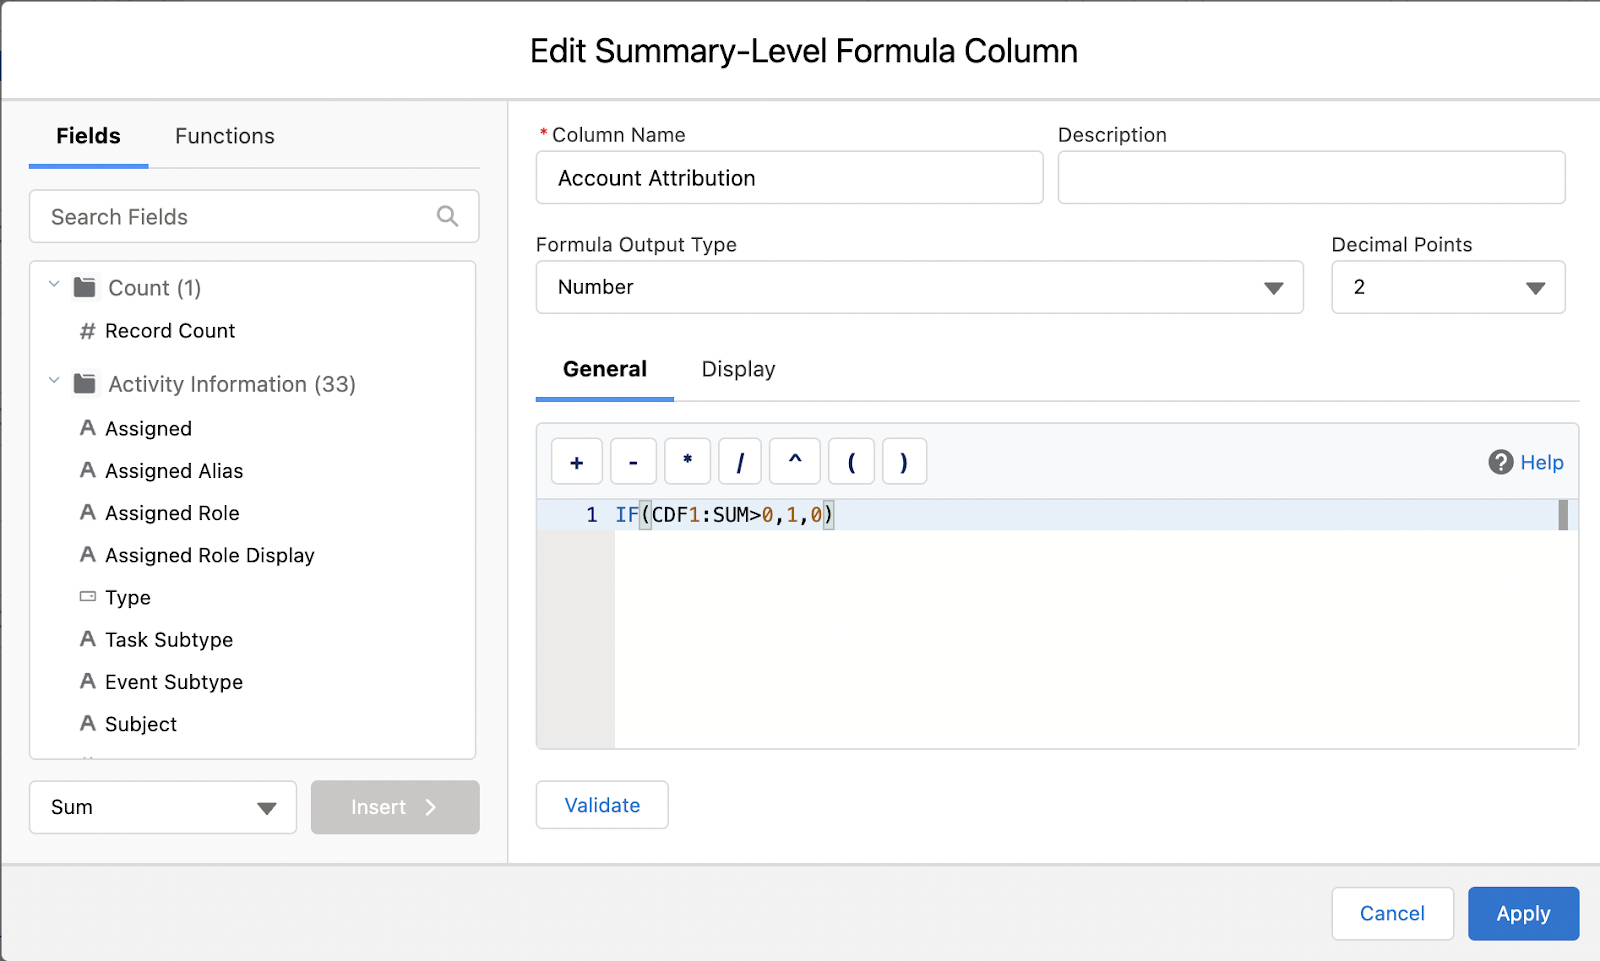
Now, input the falling formula. We are basically summing across the Signal Attribution column and checking to see if there are one or more Tasks linked to Opportunities created. If there are, we mark the Account as 1. Otherwise, we mark the Account as 0.
So what does the CDF1:SUM mean? Well, it’s actually summing across the Signal Attribution column. The best way to figure out what value to use here is to use the “Search Fields” bar and search for the column that contains your row-level formula from before. Then, hit Insert. You can also change the aggregation used by using the dropdown next to the Insert button. You will ultimately end up with a report that shows all of your Accounts with a column that indicates whether or not a Task was done prior to a new Opportunity being created.
Attribution is only valid for a certain time frame, right?
You might be thinking, “is this report attributing an outcome to a Task as long as the Task was completed before an outcome was achieved?” Here’s the problem with that: let’s say a Task occurred 1 year before the outcome was achieved. We can’t say that meaningfully contributed to the outcome.
That’s where these row-level formulas are so powerful. Remember the row-level formula we defined earlier?
IF(COMPLETED_DATE<Account.Last_Opportunity__c,1,0)
Well, we can use this formula to specify further that the task had to be completed anywhere between 0 and 14 days:
IF(AND(Account.Last_Opportunity__c-COMPLETED_DATE_TIME<14,Account.Last_Opportunity__c-COMPLETED_DATE_TIME>0),1,0)
Now you’ll be able to count a Task as being attributed to an outcome only if it occurs within 14 days of the outcome being reached.
Turning data into actionable, measurable insights with Correlated
This post just scratches the surface of what is possible with Salesforce’s built-in reporting. But you might be wondering, what “Tasks” are meaningful to measure in the first place? You have the obvious ones that are linked to Task types - perhaps it could be an email being sent or a meeting being scheduled. However, Correlated takes this one step further and allows you to measure “data insights” as well as “actionable insights”. Let’s dive in a little further on what that actually means.
Data insights are meaningful as they measure things that you care about, but might not want to act on yet. For example, a customer growing in usage by 10% is an interesting insight that you might want to know about, but doesn’t necessarily merit sales outreach yet. However, how do you know if that insight is “correlated” with a positive outcome? With Correlated, you can pipe that data insight into Salesforce as a closed Task and measure outcomes using the reports described above.
Actionable insights are essentially a subset of data insights that you want to take immediate action on. For example, a customer doubled in usage - that’s a good indicator that a sales person might want to reach out, particularly if you price by usage! However, how do you know if the sales outreach is actually effective? With Correlated, you can similarly pipe this insight into Salesforce as a Task, but in order to encourage action, you can pipe it in as an open Task first, and then build a report on completed Tasks.
You can see based on the above examples that combining Correlated with Salesforce can be very powerful. You can discover what insights matter to you and your business, encourage sales teams to take action on those insights, and ultimately measure their impact on your business outcomes.

.jpg)

